The National Examination Board (NEB) has officially released the results for the Secondary Education Examination (SEE) for the year 2082. This year’s results highlight a significant academic milestone for hundreds of thousands of students across the country.
Executive Summary
-
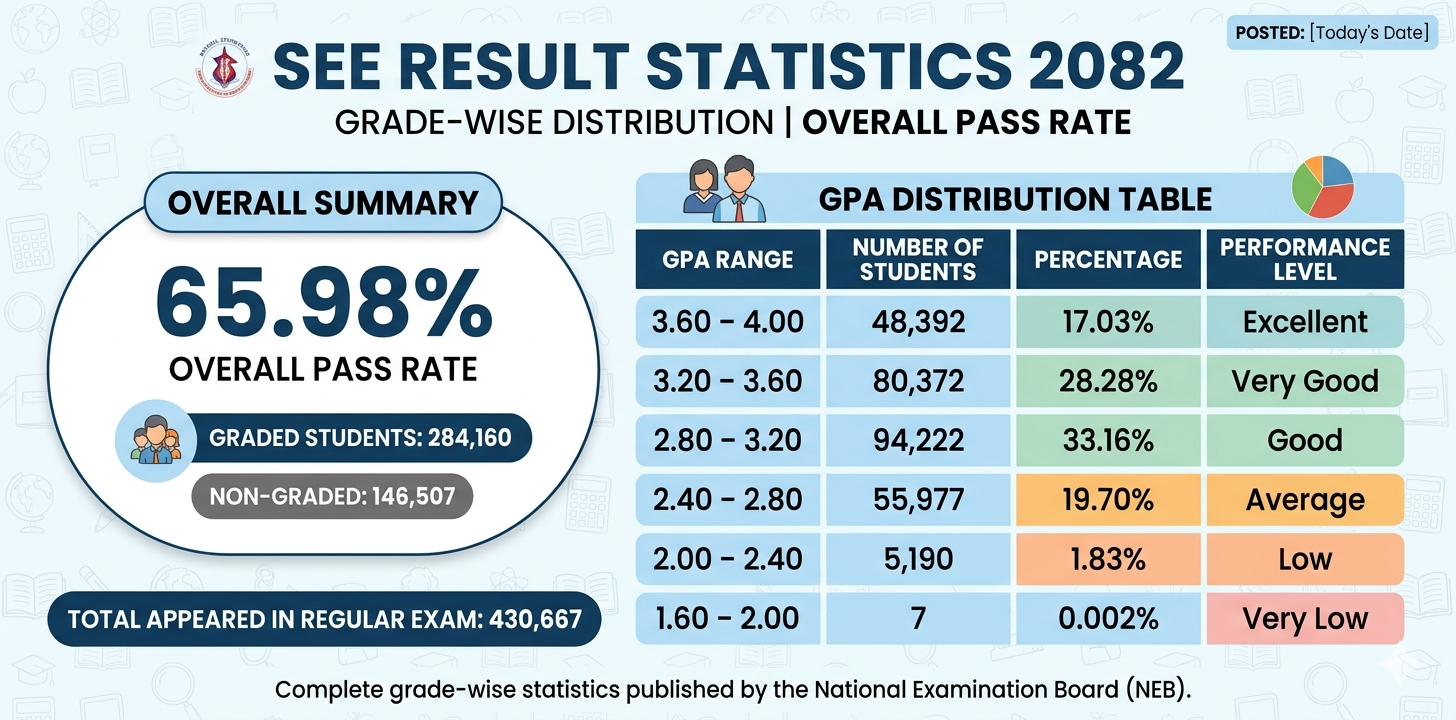
Total Appeared: 430,667 students took the regular examination.
-
Overall Pass Rate: 65.98%.
-
Graded Students: 284,160 students successfully secured grades.
-
Non-Graded (NG): 146,507 students were categorized as non-graded.
GPA Distribution Table
The following table provides a detailed breakdown of student performance based on the GPA ranges published by the NEB.
| S.N. | GPA Range | Number of Students | Percentage | Performance Level |
|---|---|---|---|---|
| 1 |
3.60 – 4.00
|
48,392 | 17.03% | Excellent |
| 2 |
3.20 – 3.60
|
80,372 | 28.28% | Very Good |
| 3 |
2.80 – 3.20
|
94,222 | 33.16% | Good |
| 4 |
2.40 – 2.80
|
55,977 | 19.70% | Average |
| 5 |
2.00 – 2.40
|
5,190 | 1.83% | Low |
| 6 |
1.60 – 2.00
|
7 | 0.002% | Very Low |
| Total Graded Students | 284,160 | Overall Pass Percentage: 65.98% | ||
Key Highlights of the Result
-
Top Performers: A total of 48,392 students achieved the highest GPA range of 3.60 to 4.00, marking them at the “Excellent” performance level.
-
Majority Bracket: The largest group of successful students, 94,222, falls within the 2.80 to 3.20 GPA range.
-
Non-Graded Status: Approximately 34% of the total examinees (146,507 students) were categorized as non-graded this year.
For more details and to check individual results, stay tuned to official government portals and authorized educational platforms.
Last Updated: 2026/05/12Source: National Examination Board (NEB)